
Twenty per cent of the inhabitants of a city have been inoculated against a certain disease. An epidemic hits the city and the chance of infection amongst those inoculated is 10
Copy and fill in the contingency table and the Venn diagram below and use them to answer the questions.
1a. Put in 20
b. Split the 20
c. Split the 80
d. Fill in the totals.
![]() 2. What proportion are infecte
2. What proportion are infecte![]() d?
d?
3. If a man is chosen at random and found to be infected, what is the chance of his having been inoculated?
4. Complete the tree diagram below for this question to give the same information as the contingency table and Venn diagram in a different way. Fill in the given percentages as fractions to show the probabilities of an individual chosen at random from the population being inoculated or not inoculated and being infected or not infected. (Note: fractions, decimals and percentages are 3 alternative ways of writing the same number.)
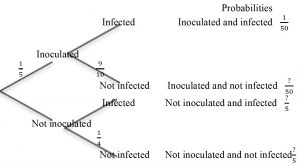
5. The chance of an infected person having been inoculated is \frac{\frac{1}{50}}{\frac{31}{50}}=\frac{1}{31}.
What is the chance of a person not infected having been inoculated?

To understand more of the maths behind health and medicine, read the article https://plus.maths.org/content/do-you-know-whats-good-you.
The EPIDEMIC Inclusion and Home Learning Guide offers related learning activities on the theme of Evidence for Decisions suitable for learners of all abilities and all ages from 5 to 18+.
Click here for the EPIDEMIC Inclusion and Home Learning Guide.
Click here for the EPIDEMIC worksheet.
Click here for the Notes for Teachers.
If you enjoyed this article, please consider sharing it!


FOLLOW US ON SOCIAL MEDIA


