AIMSSEC HAPPY MATHS GLOBAL MATHS & SCIENCE LESSON 2020
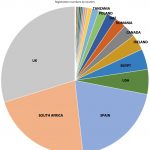
Congratulations to all the participants. The pie chart and table give the number of registrations (total 6646) and angle in the pie chart for each country (27 countries). If you participated in the 30-minute lesson then please report the actual number of participants […]
The table gives data on the land and sea covering the Earth’s surface.
(1) Explain how the percentage 69.03
(2) How would you use this percentage to find the angle for saltwater for drawing a pie chart?
A pie chart and a frequency bar chart are given below.
(3) Which of the […]
Two teams Alpha United and Beta Rovers have each played 15 matches.
The data shows how many goals the teams scored in their matches.
There are six sets of data, three showing the results for Alpha United and three for Beta Rovers.
Match the data to the teams and explain your answers.
[…]
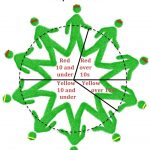
Resources needed: outdoor or indoor space and 4 long pieces of string tied together at one end. Red and yellow headbands, sashes or stickers to be distributed at the start of the lesson.
Please support AIMSSEC https://www.gofundme.com/f/benefiting-children-by-empowering-teachers
Mark out 4 regions on the ground. Adjust the age split to suit your […]
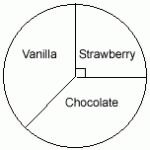
Xolile sells ice cream and the pie chart shows the sales for last week.
What fraction of the ice creams sold were strawberry? If she sold 60 strawberry ice creams how many ice creams were sold altogether.
The number of vanilla ice creams and the number of chocolate ice creams sold were the same.
[…]
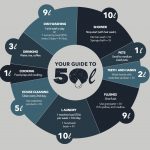
Whether or not you have plenty of water where you live it is interesting to see how we use water in our homes.
Cape Town in the 2018 dry season has a serious water shortage and water is rationed to 50 litres per person per day, as shown in this poster.
South Africa COVID-19 News
Here is the official website for COVID-19 updates.
Login
SUPPORT AIMSSEC

