
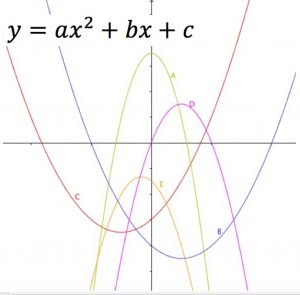
 The diagram shows the graphs of five quadratic functions or parabolas.
How do the points where the graph cuts the x axis relate to the axis of symmetry of the graph and the solutions of the quadratic equation ax^2 + bx + c = 0?
Match the graphs in the diagram to the following descriptions and give reasons for your decisions.
- y = ax^2 + bx + c if a > 0, b > 0 and c < 0.
- y = ax^2 + bx + c if a < 0, b = 0 and c > 0.
- y = ax^2 + bx + c if a < 0, b < 0 and b^2 - 4ac < 0.
- y = a(x+p)^2+q if p < 0, q < 0 and the x-intercepts have different signs.
- y = a(x+p)^2+q if a < 0, p < 0, q > 0 and one root is zero.
Click here to download the QUADRATIC FUNCTIONS worksheet.
Click here to download the QUADRATIC FUNCTIONS Guide for Parents.
If you enjoyed this article, please consider sharing it!


FOLLOW US ON SOCIAL MEDIA


