
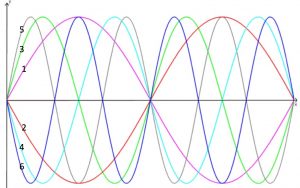
 Graph 1 is the graph y=sinx. Can you identify the coordinates of the points where it crosses the axes and where it reaches its maximum and its minimum values?
How could I make graph 2 from graph 1? Can you work out the equation of graph 2?
Graph 3 has equation y=sin2x. Can you describe how to make graph 3 from graph 1?
In each case describe how the transformation of the graph relates to the way the equation changes.
Using these ideas, can you work out the equations of graphs 4, 5 and 6?
Can you draw the same patterns using the cosine function instead? Explain how you can transform a cosine graph into a sine graph.
Click here for the TANGLED TRIG GRAPHS worksheet
Click here for the AIMSSEC Notes for Teachers.
This problem is adapted from the NRICH task Tangled Trig Graphs with permission of the University of Cambridge. All rights reserved.
If you enjoyed this article, please consider sharing it!


FOLLOW US ON SOCIAL MEDIA


