
DO NOT USE CALCULATORS FOR THIS WHOLE CLASS ACTIVITY.
YOU NEED TO KNOW: that the cosine and sine functions for ALL ANGLES are given by the coordinates of points on the UNIT CIRCLE. The x-coordinates of points on the unit circle give the cosine of the angle between the x-axis and the radius measured anti-clockwise and the y-coordinates give the sine of the angle.
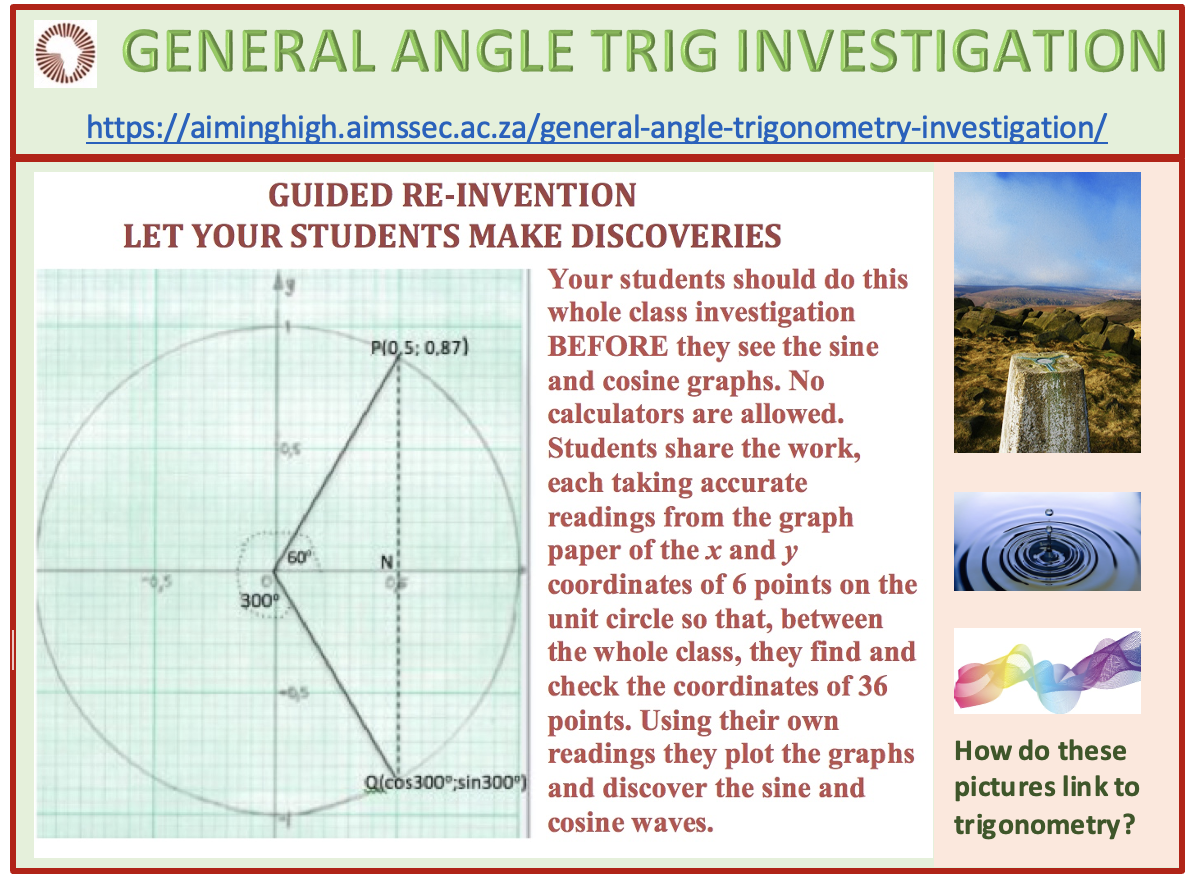
In this activity learners will share the work of taking readings of the coordinates of points on the unit circle for the angles 10^o, 20^o , ..., 350^o, 360^o. Then you will plot these points to discover what the graphs of the cosine and sine functions look like.
You will need a ruler and protractor and Sheet 1 – the Unit Circle, and one card for recording readings for each pair of learners, and Sheet 2 for recording the results from the whole class, and Sheet 3 – Graph for plotting readings from Sheets 1 and 2. 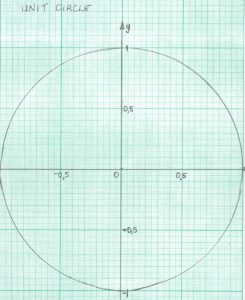
STEP 1 On S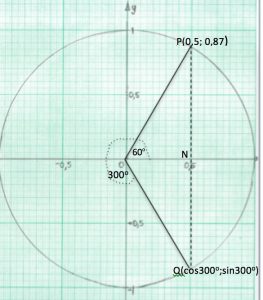 heet 1 use a protractor to measure an angle of 60o anti-clockwise from the x-axis and draw the lines OP and PNQ. The right angled triangle OPN has edges OP=1, ON=cos60o and PN=sin60o. From the lines on the grid you should see clear steps of 0,1 from -1 to + 1 in both x and y directions so you can take readings to 2 decimal places. Read the coordinates of P from the grid.
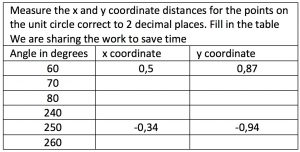
For 300o the radius is OQ and the readings are (cos300o; sin300o) =(0,5;-0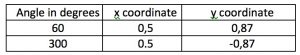 ,87) Note the sign. Readings should be recorded in a table like this.
STEP 2 Draw accurately the 6 angles on your card in this way, then take readings from the grid of the x-coordinates for cosines and the y-coordinates for sines correct to 2 decimal places, and to fill in the tables on your cards.
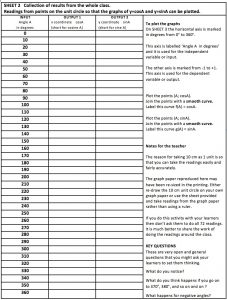
STEP 3 As a class fill in Sheet 2 using the results from the whole class. Several learners will have taken each reading so you can check that the readings are correct.
STEP 4 The next step is to plot the points (A, cos A) using Output 1 from Sheet 2. ONLY THE FIRST TWO COLUMNS ARE USED FOR cos A. You could cover the Output 2 column for sinA or fold sheet 2 to hide that column.
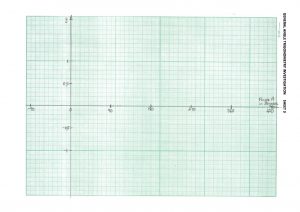
On Sheet 3 plot on the horizontal axis the values of angle A in degrees from the 1st column and on the vertical axis the values of cos A from the 2nd column.
This graph of f(A)= cosA should be a NICE ROUNDED CURVE.
STEP 5 Plot the points (A, sinA) of the function g(A)= sin A on Sheet 3 using Output 2 from sheet 2. Plot on the horizontal axis the values of angle A in degrees from the 1st column and, on the vertical axis, the values of sin A from the 3rd Again the graph should be a NICE ROUNDED CURVE.
STEP 6 What do you notice when you compare the graphs of f(A) = cos A and g(A) = sin A?
What do you think happens if you go on to 370o, 380o, and so on and on ?
What happens for negative angles?
Click here for the Notes for Teachers.
Click here for the GENERAL ANGLE poster.
Click here to download the self help CPD workshop guide on Trig. Equations and Identities.
If you enjoyed this article, please consider sharing it!


FOLLOW US ON SOCIAL MEDIA


