Water Crisis 2
Whether or not you have plenty of water where you live it is interesting to see how we use water in our homes.
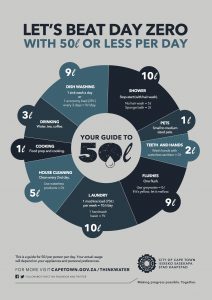
Cape Town in the 2018 dry season has a serious water shortage and water is rationed to 50 litres per person per day, as shown in this poster.
 What does the poster tell you? What is the angle for each sector in this pie chart.
Draw a double bar chart to compare this data to the earlier allocation of 87 litres per person per day.
 Can you talk to the other members of your household and make an estimate of how many litres of water your household uses in a week? From that can you estimate how much water your household uses per person per day?
Draw a bar chart or a pie chart for your household or for your class.
You will have to estimate how much water you use between you for drinking, cooking and hygeine such as cleaning teeth and also how many times people have a bath or a shower, do the washing up by hand or in a dishwasher, do the laundry by hand or in a washing machine, flush the toilet, clean the house etc.
You might also need water for your pets and farm animals, for watering the vegetables you grow, watering your garden or cleaning the car.
Click here to download the WATER CRISIS 2 worksheet.
Click here for the Notes for Teachers.
Click here for the WATER CRISIS 1 poster.
Click here for the WATER CRISIS 2 poster.
South Africa COVID-19 News
Here is the official website for COVID-19 updates.
Login
SUPPORT AIMSSEC


