
 Continue these sequences for the next three terms and continue the sequences backwards to the previous 3 terms:
7, 10, 13, 16, 19, …
15, 18, 21, 24, 27, …
1, -2, -5, -8, -11, …
What do you notice?
The first two sequences come from a multiplication table shifted up. Which multiplication table is it? What can you say about the third sequence?
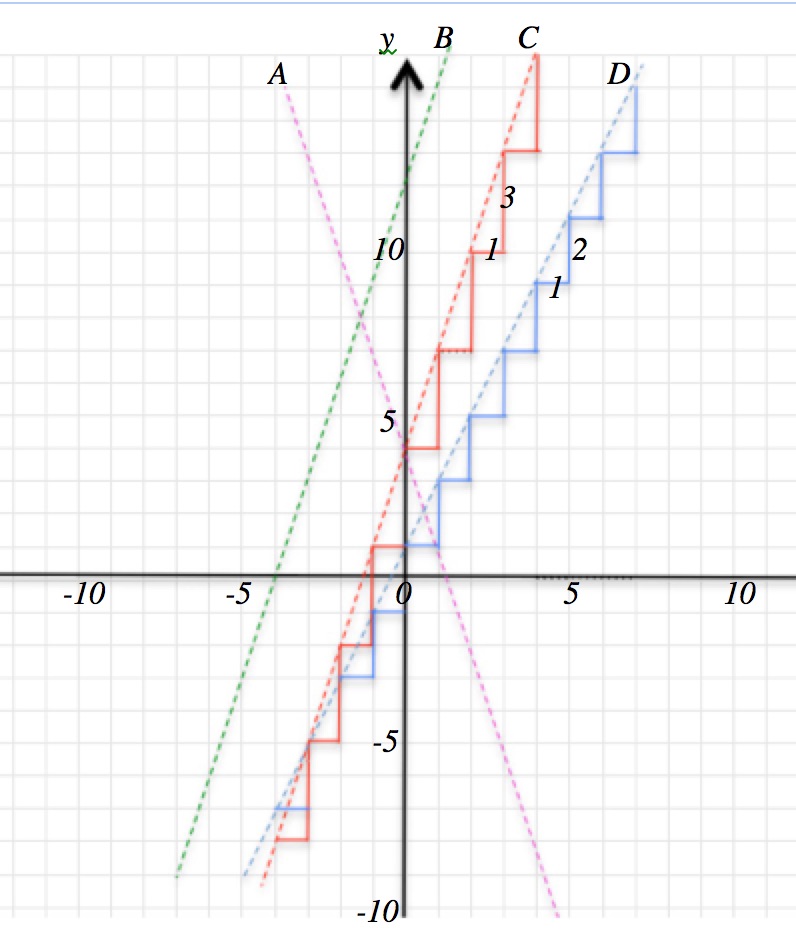
How do the red steps in the diagram relate to the first sequence?
How do these sequences relate to the lines A, B and C in the diagram? Which sequence relates to which line?
How does the sequence 3, 5, 7, 9, 11, … relate a multiplication table and to the blue steps in the diagram? How does it relate to the line D in the diagram?
Imagine you are climbing the red steps from the point (-3 , -5) to the point (3, 13). Now imagine you climb the same number of the blue steps from the point (-3, -5) to the point (3, 7). Which is the steeper climb? Why? How could you measure the steepness of the climb?
When plotting points with WHOLE NUMBER coordinates given by the sequences use the variables n for the number of the term and t for the term in the sequence.
For the equation of the line with ALL the points, and extending the line in both directions, use the variables x and y.
Match the following equations to the lines in the diagram.
E_1: y = 3x + 12 \\ E_2: y = 2x + 1 \\ E_3: y = -3x + 4 \\ E_4: y = 3x + 4Click here to download the STEPS worksheet
Click here to download the STEPS Notes for Teachers.
If you enjoyed this article, please consider sharing it!


FOLLOW US ON SOCIAL MEDIA


