
Currently viewing the category:
"Lesson Activities"
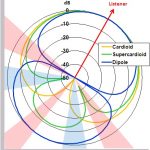
Cardioid technology is used in microphones and speakers. Cardioids appear in the motion of planets and in many other ways. See this YouTube video.
To draw a cardioid, first draw a circle, then carefully mark 36 points around the circle at 10 degree intervals and number the points n = 0 […]
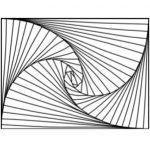
a) To draw this pattern, first draw a rectangle.
b) Choose a small distance d, mark this distance along the edge of the rectangle and draw a straight line from one vertex of the rectangle to this point as in Step 1.
c) Mark the distance d along the next edge and […]
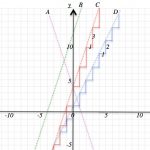
Continue these sequences for the next three terms and continue the sequences backwards to the previous 3 terms:
7, 10, 13, 16, 19, …
15, 18, 21, 24, 27, …
1, -2, -5, -8, -11, …
What do you notice?
The first two sequences come from a multiplication table shifted up. Which […]
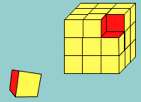
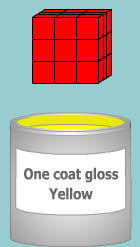
Imagine a large cube made up from 27 small red cubes each measuring 1 cm by 1 cm by 1 cm. What is its volume?
Imagine dipping the large cube into a pot of yellow paint so the whole outer surface is covered. What is its surface area?
Now imagine breaking the […]
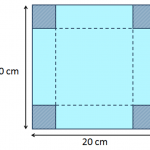
Take a sheet of paper 20 cm by 20 cm and make a box without a lid by cutting out a square at each corner and folding up the flaps. What is the volume of your box?
Make boxes with different volumes by varying the sizes of the squares that you cut […]
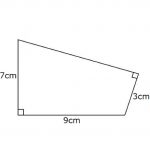
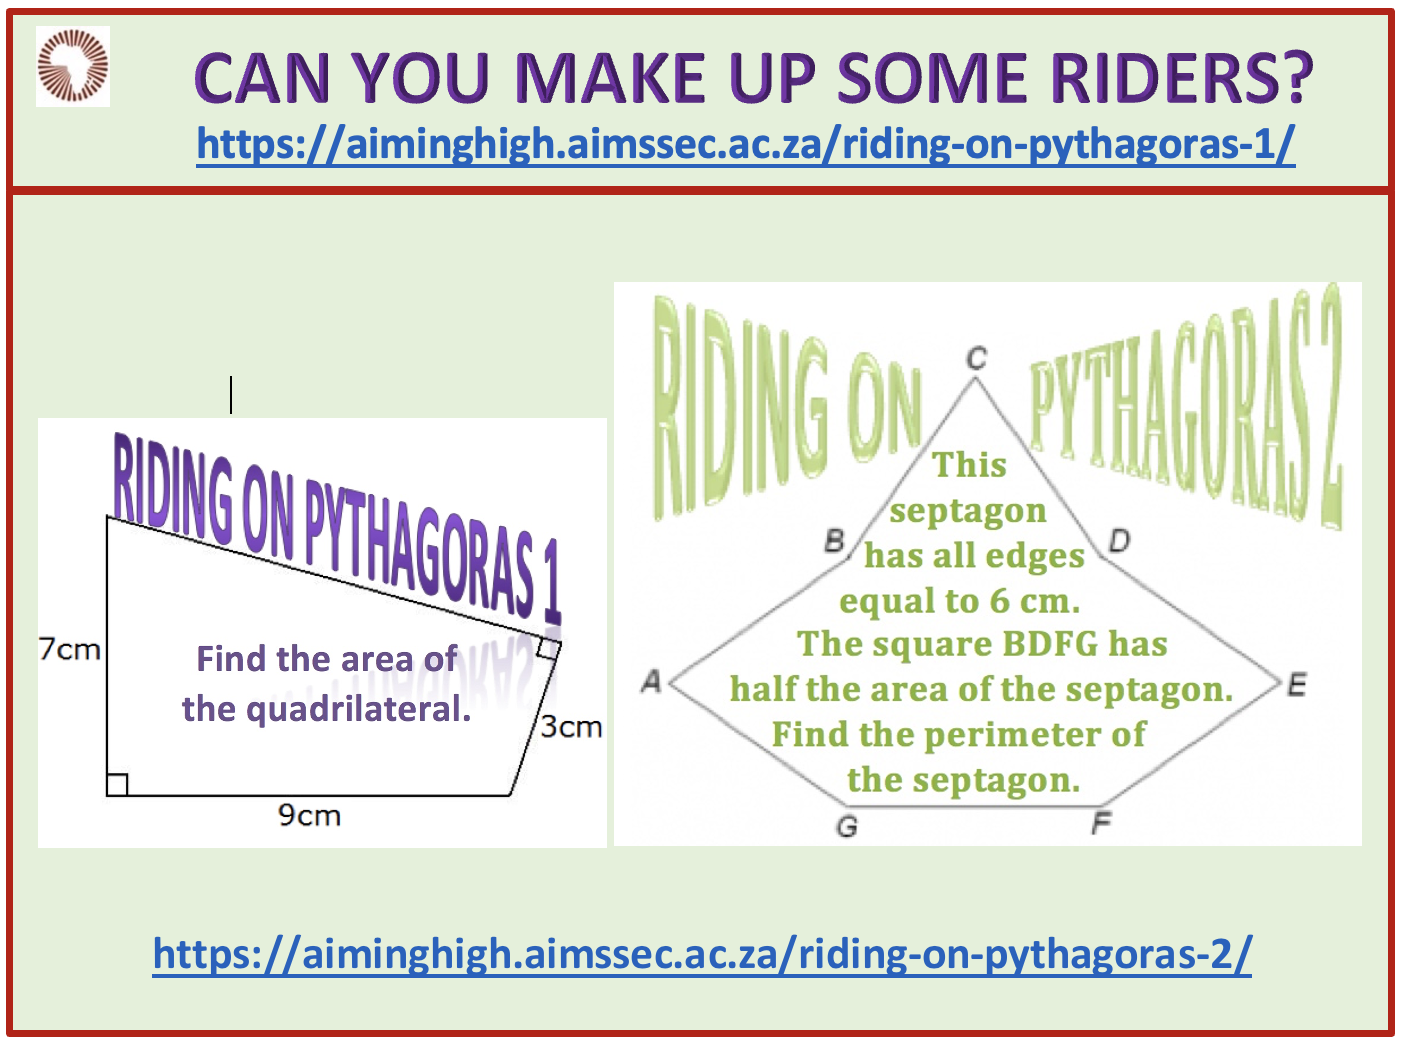
1. Find the area of the quadrilateral.
2. The rectangle is cut into two pieces along the dotted line and rearranged to make a triangle. Find the perimeter of the triangle.
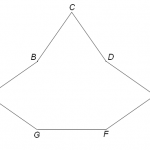
The diagram shows a septagon ABCDEFG in which the lengths GA, AB, BC, CD, DE, EF are all equal and FG = 6 units. The area of the square BDFG is half the area of the septagon. Find the perimeter of the septagon.

If three of the four expressions: 2x – 3 and x + 8 and 2x + 3 and 30 – x are equal, find their value and which expression is the odd one out.
Copy and label the diagram and explain the connection between the diagram and the first part of the […]
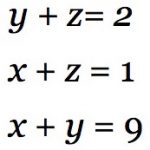
Add up these 3 equations. What do you notice?
Find the values of x, y and z.
Now add up all 5 equations given below. What do you notice?
b + c + d + e = 4
a + c + d + e = 5
a + […]
Here is an alternative version of the “Think of a Number” trick.
Think of two whole numbers under 10.
Take one of them and add 1.
Multiply by 5.
Add 1 again.
Double your answer.
Subtract 1.
Add your second number.
Add 2.
Double […]
FOLLOW US ON SOCIAL MEDIA


