
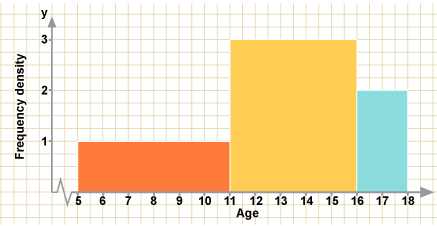
 The histogram shows the number of children in each age group on a school bus. There are no children under 5 years and no children over 17 years. There are 6 children aged between 5 and 10 years . Explain why the class boundaries are 5, 11, 16 and 18. Complete the following table. How many children are there on the bus altogether?
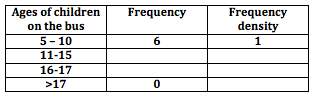
Remember that in a histogram, it is the area of the bar that represents the frequency.
It would therefore be incorrect to label the vertical axis ‘frequency’ and the label should be ‘frequency density‘.
Click here to download the HISTOGRAM worksheet.
Click here to download the Notes for Teachers – Histogram
If you enjoyed this article, please consider sharing it!


FOLLOW US ON SOCIAL MEDIA


