
Currently viewing the tag: "Venn diagrams"
Click here for the GTEN workshop video that provides learning activities and suggestions for teaching to develop an understanding of probability and the skill of decision making in situations involving chance.
The Global Teacher Empowerment Network (GTEN) videos provide resources for differentiation and inclusion, with guidance and learning […]

Twenty per cent of the inhabitants of a city have been inoculated against a certain disease. An epidemic hits the city and the chance of infection amongst those inoculated is 10
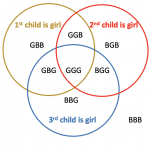
Copy and fill in the contingency table and the Venn diagram below and use them to answer the questions.
1a. Put in 20
b. […]
Practical people maths activities forming human Venn diagrams and contingency tables. Applications to real world problems.
Click here to download a pdf with all you need to run your own professional development workshop.
FOLLOW US ON SOCIAL MEDIA


