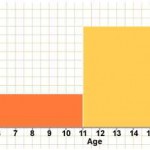
The histogram shows the number of children in each age group on a school bus. There are no children under 5 years and no children over 17 years. There are 6 children aged between 5 and 10 years . Explain why the class boundaries are 5, 11, 16 and 18. Complete the following table. […]
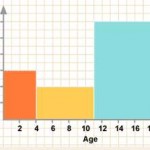
The ages of children arriving at a zoo in 1 hour are noted by the ticket salesman. There are 12 children between 0 and 3 years old, 14 children between 4 and 10 years old and 48 between 11 and 18 years old.
He draws a bar graph or frequency diagram to represent this […]
The table gives the 2013 population statistics for South Africa.
Complete the table and draw a histogram to represent this data.
Calculate the mean of this distribution. What can you say about the other measures of central tendency (the median and the mode)?
According to news reports in 2013 Johanna […]
South Africa COVID-19 News
Here is the official website for COVID-19 updates.
Login
SUPPORT AIMSSEC


