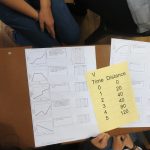
This lesson is about moving between different representations of distance-time functions, namely between graphs, stories and tables. This activity should be given to the class as a formative assessment activity: it is designed to provide the teacher with information about the learners’ current levels of understanding.
During a short introduction the teacher displays a […]
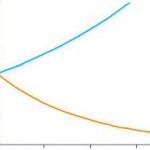
The graph shows the distance along a race track for two racing cars as they approach a bend in a race. Copy the table below, take readings from the graph and fill in the table for the first 10 seconds.
How far does each car go in the 3rd second? How far […]
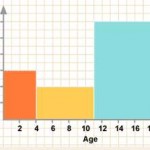
The ages of children arriving at a zoo in 1 hour are noted by the ticket salesman. There are 12 children between 0 and 3 years old, 14 children between 4 and 10 years old and 48 between 11 and 18 years old.
He draws a bar graph or frequency diagram to represent this […]
The table gives the 2013 population statistics for South Africa.
Complete the table and draw a histogram to represent this data.
Calculate the mean of this distribution. What can you say about the other measures of central tendency (the median and the mode)?
According to news reports in 2013 Johanna […]
If an object depreciates in value by 10
Why aren’t these two answers the same?
Is there a rate, used for both gain and depreciation, for which those two answers would actually be the same?
See the notes for teachers and solution and also http://nrich.maths.org/5636
South Africa COVID-19 News
Here is the official website for COVID-19 updates.
Login
SUPPORT AIMSSEC


