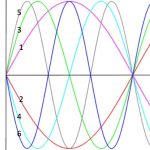
Graph 1 is the graph y=sinx. Can you identify the coordinates of the points where it crosses the axes and where it reaches its maximum and its minimum values?
How could I make graph 2 from graph 1? Can you work out the equation of graph 2?
Graph 3 has equation y=sin2x. […]
(1) Plot the graphs of the straight lines y = x, y = 1.1x – 0.2
and y = 0.9x – 0.1
What do the graphs tell you about the solutions to the two pairs of simultaneous equations (1a) y = x y = 1.1x – 0.2 and (1b) y = x […]
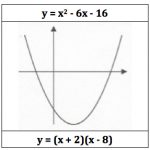
Graphs and equations of 7 quadratic functions are given here.
Match them and put them into 7 sets. Write down the coordinates of the intercepts with the axes.
Make a poster showing the graph of each function with the matching equations.
In […]
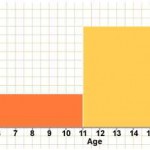
The histogram shows the number of children in each age group on a school bus. There are no children under 5 years and no children over 17 years. There are 6 children aged between 5 and 10 years . Explain why the class boundaries are 5, 11, 16 and 18. Complete the following table. […]
Two teams Alpha United and Beta Rovers have each played 15 matches.
The data shows how many goals the teams scored in their matches.
There are six sets of data, three showing the results for Alpha United and three for Beta Rovers.
Match the data to the teams and explain your answers.
[…]
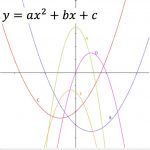
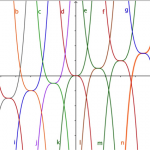
The diagram shows the graphs of five quadratic functions or parabolas.
How do the points where the graph cuts the x axis relate to the axis of symmetry of the graph and the solutions of the quadratic equation ?
Match the graphs in the diagram to the following descriptions and give reasons […]
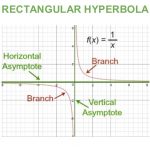
1. Which one of the graphs represents the function $f(x) = \frac{1}{x}$?
The table below has been jumbled up. Match the graphs labelled f1 to f9 to their equations in the table below and to the descriptions of the transformations of $f(x) = \frac{1}{x}$
Download the worksheet, cut […]
The picture shows some curves in the family of y = x cubed. Can you find the graph of this function and the equations of the other graphs? In this workshop guide you will find more examples of this type of ‘inverse problem’ where the learner is given information and has to […]
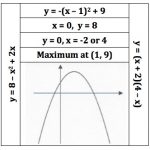
The graphs and some properties of seven quadratic functions are given here.
The equation of each function is given in three different forms.
Match the graph of each function with the matching equations and properties.
This activitiy is linked to Quadratic Matching 1 which you […]
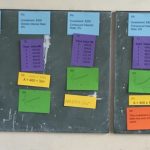
Comparing investments: there are six investments. Find all the representations (description, formula, graph and table of values) of a single investment. After this, work out which statement fits with which investment.
The teacher leads a very short discussion about the different types of investments, reminding the learners about simple and compound interest. He or […]
South Africa COVID-19 News
Here is the official website for COVID-19 updates.
Login
SUPPORT AIMSSEC

