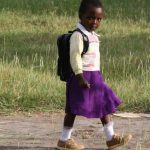
This activity is about journeys to school, your own journeys and journeys to school by other children. Watch this video https://www.youtube.com/watch?v=rYA8SbqRwt8
The picture shows a 5 hour journey into the mountains on a narrow path to probably the most remote school in the world in Gulu, China.
The […]
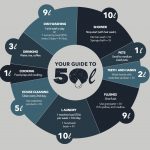
Whether or not you have plenty of water where you live it is interesting to see how we use water in our homes.
Cape Town in the 2018 dry season has a serious water shortage and water is rationed to 50 litres per person per day, as shown in this poster.
Introduction to the data handling cycle and collection and representation of data in a human pie chart and a variety of practical ways that involve the whole calss.
Click here to download a pdf with all you need to run your own professional development workshop.
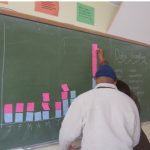
Class 4 have made a bar chart showing the months of their birthdays.
Which is the month with no birthdays?
Which months have four birthdays?
How many children are in the class?
Make a birthday bar chart for your class by writing your name or initials in one […]
The diagram shows a tally chart and bar graph done by Adam and Mary for their class. Adam’s name had the most common initial letter and Mary’s the least common.
Make a list of the first names of all the learners in your class. What do you notice about […]
The table gives the 2013 population statistics for South Africa.
Complete the table and draw a histogram to represent this data.
Calculate the mean of this distribution. What can you say about the other measures of central tendency (the median and the mode)?
According to news reports in 2013 Johanna […]
South Africa COVID-19 News
Here is the official website for COVID-19 updates.
Login
SUPPORT AIMSSEC


