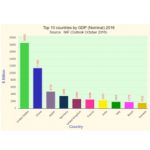
The graph and table show the Gross Domestic Products (GDP) of the world’s top ten economies in 2016 and the forecast for 2030.
Draw a double bar chart to compare the GDPs for these eleven countries in 2016 and 2030 (forecast).
Which countries are in the top […]
This data from the World Health Organisation portrays the growth in the number of confirmed cases of the coronavirus disease. In some countries the pattern appears to be exponential growth. Data is given for the most affected countries and for the two countries in Africa with more than 10 cases.
In one week, new data […]
In 2018 Cape Town was in danger of running out of water. Half a billion people in the world face severe water scarcity all year round. Half of the world’s largest cities experience water scarcity
In 2018 the City of Cape Town rationed everyone to 87 litres a day and published this […]
Class 4 have made a bar chart showing the months of their birthdays.
Which is the month with no birthdays?
Which months have four birthdays?
How many children are in the class?
Make a birthday bar chart for your class by writing your name or initials in one […]
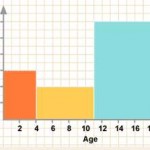
The ages of children arriving at a zoo in 1 hour are noted by the ticket salesman. There are 12 children between 0 and 3 years old, 14 children between 4 and 10 years old and 48 between 11 and 18 years old.
He draws a bar graph or frequency diagram to represent this […]
South Africa COVID-19 News
Here is the official website for COVID-19 updates.
Login
SUPPORT AIMSSEC


