Discuss these charts. The first was published in August 2020, and is similar to Florence Nightingale’s 1885 pie charts. In both charts the radial distance gives the number of deaths for a year and both were produced to convey a health warning and send messages to the British Government. What do you think these messages […]
This is not an activity to do on your own. The suggested plan is that you take the discussion points one by one, perhaps one a week, and discuss them at school or at home. You might look at https://ourworldindata.org/coronavirus for the latest statistics when you have your discussion.
There is […]
This data from the World Health Organisation portrays the growth in the number of confirmed cases of the coronavirus disease. In some countries the pattern appears to be exponential growth. Data is given for the most affected countries and for the two countries in Africa with more than 10 cases.
In one week, new data […]
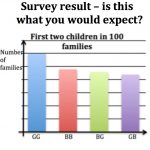
Mathematical modelling and making real life connections is the focus of this guide. The use of tree diagrams in probability is developed starting with collecting data to model the numbers of boys and girls in families and the orders in which they occur. The connections between the underlying mathematics in these situatons, […]
South Africa COVID-19 News
Here is the official website for COVID-19 updates.
Login
SUPPORT AIMSSEC


