
Posts by: toni
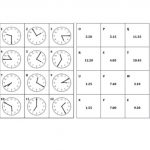
Match the times shown on the clocks to the times written in numbers.
Put them in order earliest to latest.
Pick 3 of the times, perhaps your favourite times of day. Make up a story about what happens at those times.
Download the clock cards here and the times cards […]
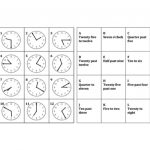
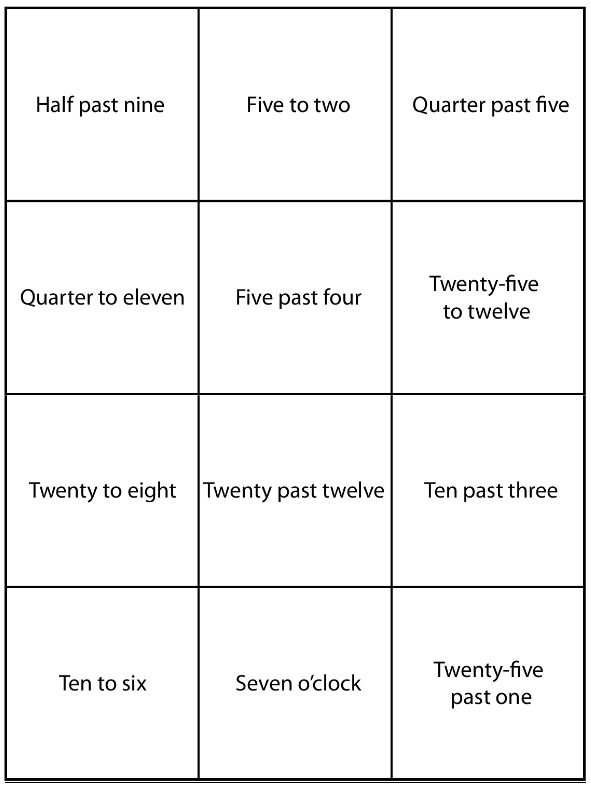
Match the times shown on the clocks to the times given in words.
Put them in order.
Pick 3 of the times, perhaps your favourite times of day. Make up a story about what happens at those times.
Download the clock cards here and the times in words cards here.
[…]
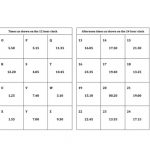
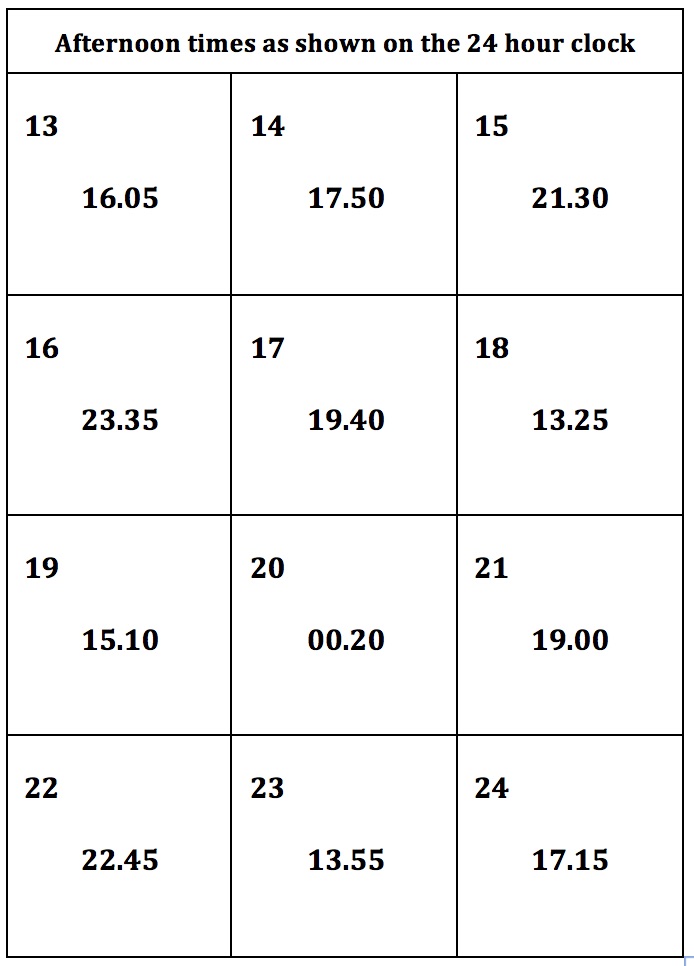
If all these times are between noon and midnight match the times given on the 12 hour clock with the times given on the 24 hour clock. Put them in order.
Download the 12 hour times cards here and the 24 hour times cards here.
Now match all the […]

Easy starter: Write down 2 numbers that add up to a million, one smaller than 450 000 and one bigger than 450 000.
If you shared a prize of one million dollars between 7 people how many dollars would each get?
What is the easiest way to work out which of the […]
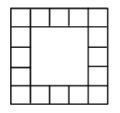
This square of squares pattern has edge length 5 squares. You could make this pattern with 48 matchsticks.
Work out the number of edge squares and the number of lines (matchsticks) needed to make the pattern with: side length 6, side length 25, side length 100, side length n.
Click here […]
You have 2 different bags of marbles.
One bag has 3 Red and 2 Blue the other has 5 Red and 3 Blue.
Mzo picks one marble from each bag at random.
What is the probability he picks one of each colour? What is the probability he does NOT pick a […]
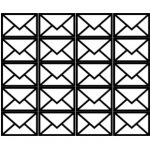
In front of you there are 20 envelopes.
Eight of the envelopes each contain 5 blue and 3 red sheets of paper.
The other 12 envelopes each contain 6 blue and 2 red sheets of paper.
You choose one envelope at random. Then you choose a sheet of paper from it at […]
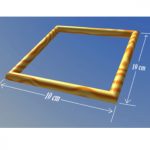
This stand is made from cylindrical wooden dowel of diameter 1 cm joined at the corners with 45 degree mitres.
The external dimensions of the stand are 10 cm by 10 cm.
What are the volume and surface area of the stand?
The sketch below shows how I marked […]
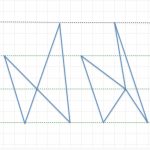
Find the total area of the two red triangles by two different methods if ACD and BCE are straight lines .
What are the lengths PC and CQ?
The triangles are re-drawn with PC = x cm and CQ = y cm keeping the total area the same and keeping the distances between the green […]
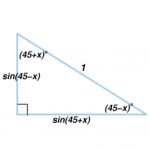
Draw a triangle with angles x, (45 + x) and (45 – x) degrees.
What does Pythagoras Theorem tell you about these angles?
Use this information to find this sum of squares of sines:
Click here to download the DEGREE CEREMONY worksheet.
See the AIMSSEC Notes for Teachers.
Click […]
FOLLOW US ON SOCIAL MEDIA


![the times cards […]](https://aiminghigh.aimssec.ac.za/wp-content/uploads/2017/08/TIMES-12-h-clock.jpg)