Car Racing
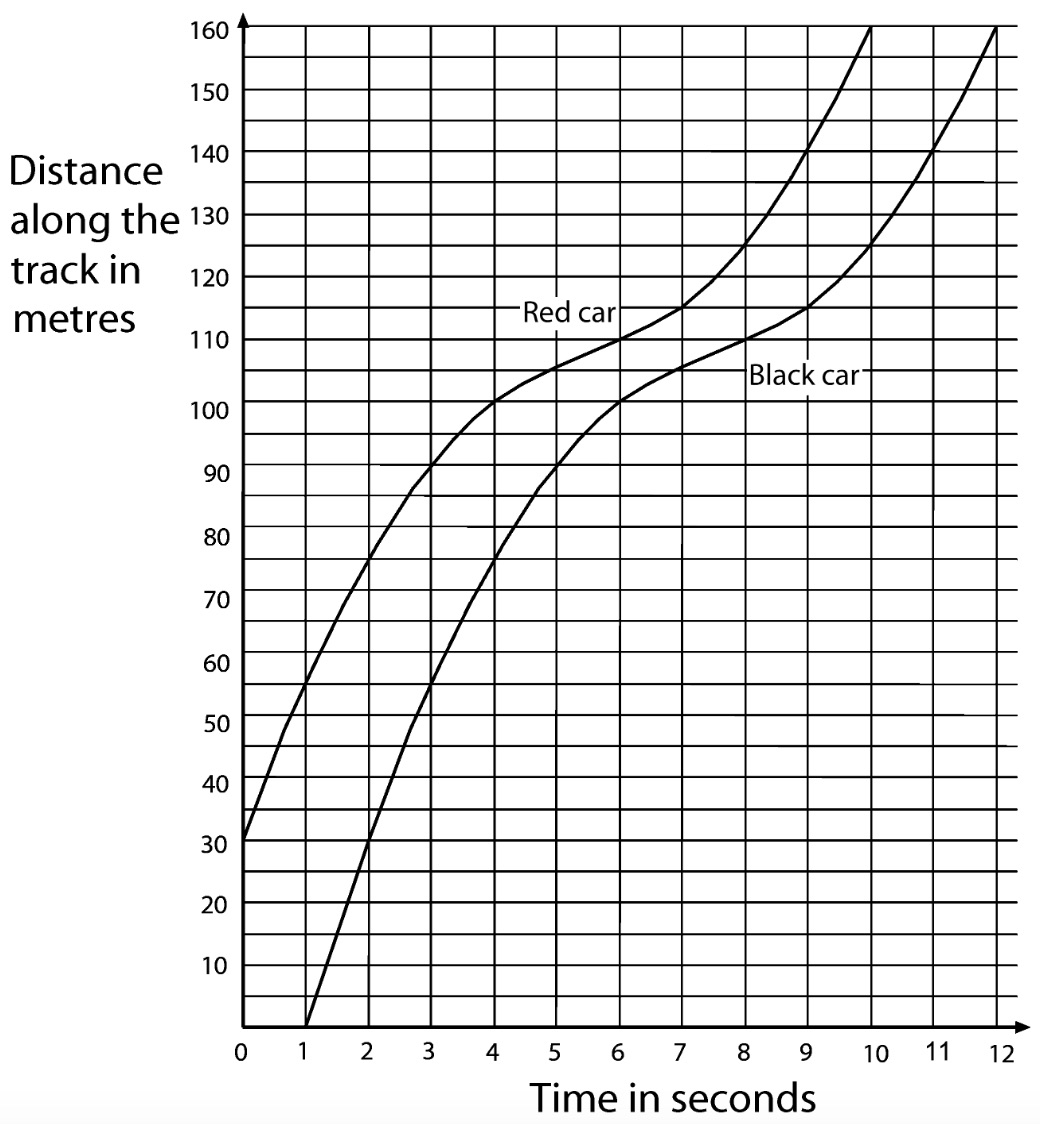
 The graph shows the distance along a race track for two racing cars as they approach a bend in a race. Copy the table below, take readings from the graph and fill in the table for the first 10 seconds.
How far does each car go in the 3rd second? How far does each car go in the 6th second?
When does the red car start slowing down for the bend? When does it start increasing its speed as it comes out of the bend?
When does the black car start slowing down for the bend? When does it start increasing its speed as it comes out of the bend?
Describe how the distance between the cars changes.
What is the time delay between the red car reaching points on the track and the black car  reaching the same points? Do you think the black car catches up with the red car? Explain why or why not.
Make a guess based on the graph about where the red car will be and fill in the table for the last two seconds of this part of the race.
Pretend you are a commentator and describe what is happening. When are the cars slowing down and when are they speeding up?
South Africa COVID-19 News
Here is the official website for COVID-19 updates.
Login
SUPPORT AIMSSEC


